

Climate Emergency UK have just completed a mammoth exercise where they have scored every council in the country on the actions they have taken to address the climate crisis. It provides the first ever independent assessment of how much progress councils are making. The results are decidedly mixed. They highlight which councils have made most progress and which are lagging behind. And they show how much there is still to be done at council level to really spark change.
This blog spotlights how councils in the South East scored, and allows you to compare your council with others in our region. It ends with suggestions on how both climate action groups and local councils can use the scorecard to learn from others and spur future action.
About the scorecard
In 2022, Climate Emergency UK (CEUK) published a scorecard of council climate action plans. Now they have taken a huge step further by carrying out an independent assessment of how far councils have got in turning those plans into measurable action.
The CEUK climate action scorecards can be found here: https://councilclimatescorecards.uk/
It has been a mammoth task. The results provide a rich resource both for holding councils to account and focusing minds on what still needs to be done. By holding up a mirror for councils, the hope is that the scorecard exercise will prompt reflection and raise ambitions. It is action that is important, not league tables.
Using a detailed scoring system, the assessment involved up to 91 different questions, depending on the council type, across 7 major subject areas – from buildings to biodiversity. Weightings were given to each question to reflect the impact of that measure on reducing emissions (high, medium or low). These subject scores were then aggregated to create an overall total score, expressed as a percentage – with 100% representing a council that is taking comprehensive climate action across the board.
More details on how the scorecards were created are provided below, along with some caveats that need to be born in mind. But let’s start with the results.
National headlines
Over the whole of the UK the total scores achieved are generally low, which shows that councils have a long way to go. The average total score across all council types was around 33%, suggesting that councils are doing just a third of what they could be under their current powers to address climate change.
This is not surprising. As CEUK puts it: “there are national barriers for local authorities such as lack of funding and policy U-turns that make it harder for most councils to deliver the necessary climate action”. However, when you drill down, there is a much variation between councils. Some have achieved high scores in some categories “which shows that other local factors, such as political will and ambition are at play”. There is an urgent need for national support, funding and comprehensive national policies to help councils to deliver climate action. But the results show the potential is there for councils to have a major influence through their decisions and policies, even with their limited current powers and funding.
The picture in the South East
SECA has been taking a closer look at the results for councils across the South East. In the following sections we pull out some of the headlines on which councils have scored best and worst, and why. To find out more we encourage you to explore the individual council scores on the CEUK website.
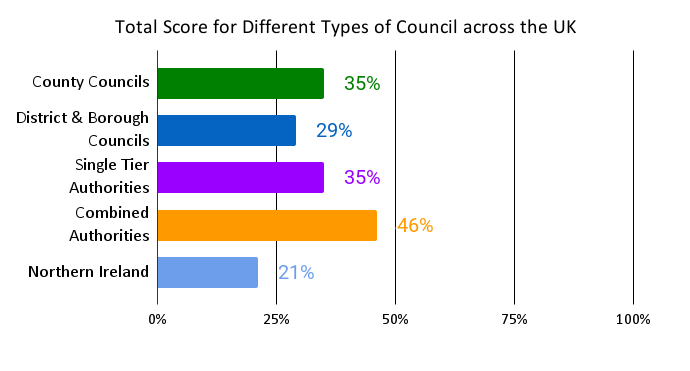
We have also created a series of bar charts where councils in our region are ranked according to their total scores, as well as their individual scores for the seven different subject themes. In each case, county councils are shown in green, district and borough councils in blue, and single tier authorities in purple. To help with comparisons, the average score for each type of council across the UK is show with a light coloured bar.
Total score
The graph below shows the total score for every council in the South East. You can click on the image to enlarge it. Some of the key headlines aret:
- The top scoring county council in the region was East Sussex, at 42%, followed by Hampshire, Surrey, Kent and West Sussex.
- Amongst district councils, Winchester scored highest at 49% (and had the fifth highest district council score in the UK). Lewes came next with 46% and Eastbourne 45%.
- 27 district councils scored more than the national average of 29% of and 18 scored less.
- Overall, the lowest district council scores in our area were Havant at 16%, and Rother at 15%
- Amongst single tier councils in the region Brighton and Hove scored highest at 50%, more than twice the score of the Isle of Wight, at 24%.

Building & Heating
 This category is where councils can have some of the biggest impacts on area-wide greenhouse gas emissions, so it is given a high weighting in the total scores.
- Amongst county councils, Surrey scored very highly with 92%. Some of the criteria they met include:
- Offering funding to private renters or homeowners to retrofit their homes – “Since October 2020 Surrey’s Local Authorities, working as a consortium with Action Surrey, have drawn down approximately £29 million in Government funding to decarbonise housing until 2023.”
- Supporting local community renewable energy creation by “partnering with Community Energy South to support community-led renewable energy projects in Surrey”.
- Being part of a partnership to support home retrofitting, through providing the skills and training needed. “Surrey has funded training for heat pump engineers through East Surrey College and the Energy Training Network.”
- Amongst district councils the average score was 40%.
- Thanet scored highly at 68%.
- Thanet was one of only 3 district councils in the UK that scored maximum points for actively enforcing minimum energy efficiency standards in homes in the private rented sector – which is one of the measures with the highest weighting. They issued 183 compliance orders in 2021-22.
- Other points are scored, for example, by supporting local community renewable energy, having energy efficient homes that are owned and managed by the council, and having a staff member employed to work on retrofitting across the council area.
- Amongst single tier councils, Brighton and Hove also scored highest at 82%.
 Transport
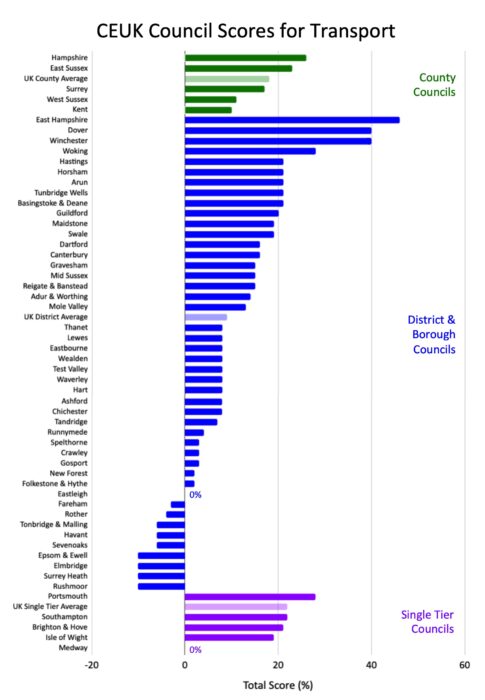
- For county councils, this area is the one where they can have most influence on emissions. Worryingly the transport scores for counties were generally low (the UK average is only 18%).
- The measures that would attract high weightings for counties are imposing workplace parking levies and supporting active travel (which is assessed nationally by Active Travel England). Medium weightings are given to high bus ridership levels, Clean Air Zones and controlled parking in residential areas. Negative scores are given for approving new road schemes or expanding airports.
- Hampshire scored highest with 26%. They were well scored by Active Travel England.
- West Sussex (11%) and Kent (10%) were marked down by zero/low scores from Active Travel England, and negative scores for building/approving new road schemes.
- For district councils, the UK average score was only 9%. East Hants scored highest in the South East with 46%. Winchester and Dover scored 40%.
- District councils are scored on far fewer questions in this section because they are not transport authorities. However they can score by setting up a shared transport scheme (eg Dover’s ‘Click2cycle’ scheme) and/or significantly expanding the network of public EV chargers.
- District councils can get negative transport marks from approving or building a high carbon transport project or exceeding WHO safe air pollution limits of NO2 or PM2.5. This lost a lot of councils marks. It applies to Elmbridge, Epsom, Rushmoor and Surrey Heath, who all scored -10% on this section. Eastleigh attracted negative marks for approving Southampton Airport Parkway.
- Portsmouth scored highest amongst single tier councils (28%) with Medway the lowest (0%).
Planning & Land Use
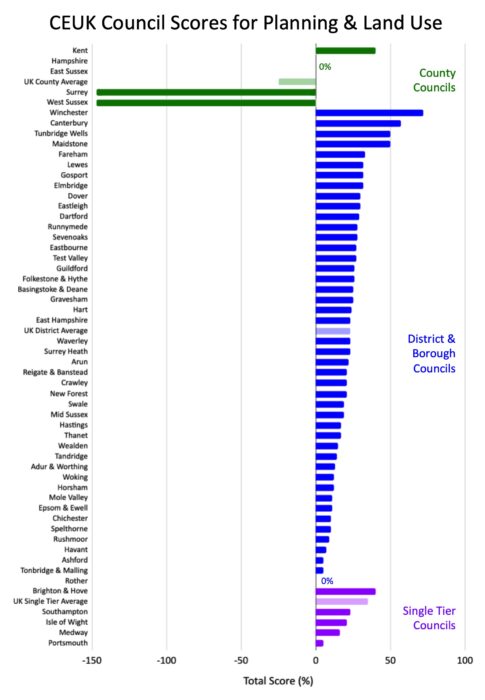 Across the board, scores for planning and land use were very low, an indicator of how much is to be done in this department. It is an area in which district councils can have particular influence through their planning powers.
- The average score for planning for county councils in the UK was actually negative (- 25%).
- In the South East, only Kent scored a positive score (40%) while West Sussex and Surrey both scored a whopping minus 147%. Their large negative scores reflect the lack of planning decisions to support new solar or wind developments, battery storage, or renewable district heat networks since 2019. This is alongside approving planning applications for carbon intensive energy systems in that period (expansion of Lidsey oil well operational hours, and approval of new oil wells at Horse Hill, respectively).
- The average planning score for district councils was 23%.
- Winchester scored highly at 61%, with Canterbury at 48%. Rother was notable for scoring zero.
- District planning scores are boosted substantially by approving applications for new solar/wind/battery storage or district heat networks and by setting a requirement that all new homes to be built must be operationally net zero.
- Other steps that score well are having net zero as a strategic objective in the Local Plan; having a ‘fabric first’ approach to local planning policy, and committing to building all future council owned housing to operational net zero. They can also require developers to carry out whole life cycle carbon assessments, to have a high level of water efficiency for new homes and have on site renewable energy. They can remove minimum parking requirements for new homes and avoid building developments on flood plains.
- Brighton & Hove scored best among unitary authorities with 40%, while Portsmouth only scored 5%.
 Governance & Finance
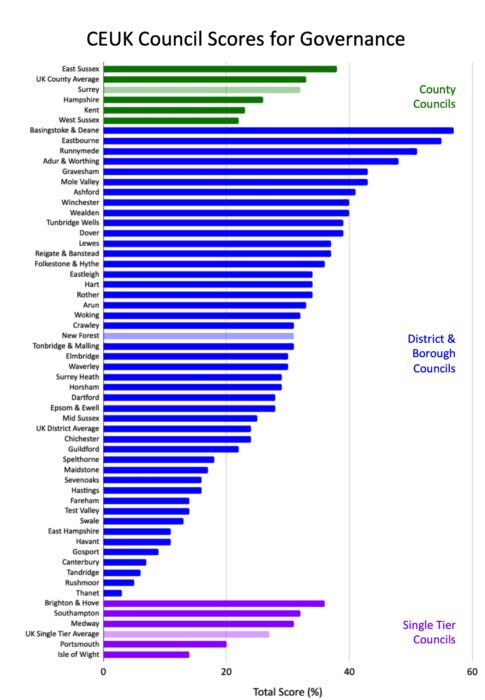
There are a range of governance and financial measures that contribute to these scores:
- Embedding climate action and decreased waste in the council’s procurement policies is one that carries high weighting, since buying in goods and services is the biggest source of carbon emissions for most councils.
- Adopting new governance processes to put the climate emergency at the heart of all everyday decisions is also recognised, as is the proportion of staff working on climate projects and the percentage of staff and councillors who have had climate awareness training.
- In the financial sphere measures that raise income for climate action from local climate bonds, from property developers or from other sources are recognised (eg Worthing has been awarded £5.3m in Govt funding for the Worthing Heat Network using heat from sewers).
- Divestment of council pension funds away from fossil fuels also contributes.
- Amongst county councils in the southeast, East Sussex scored highest in this category (38%) with next door West Sussex scoring lowest (22%).
- The average score for districts was low at 24%. Basingstoke, Eastbourne, Runnymede and Worthing all scored fairly highly with over 50% .
- But Tandridge, Rushmoor and Thanet all scored 5% or less.
- Brighton & Hove scored best among unitary authorities (36%), while the Isle of Wight had the lowest score (14%).
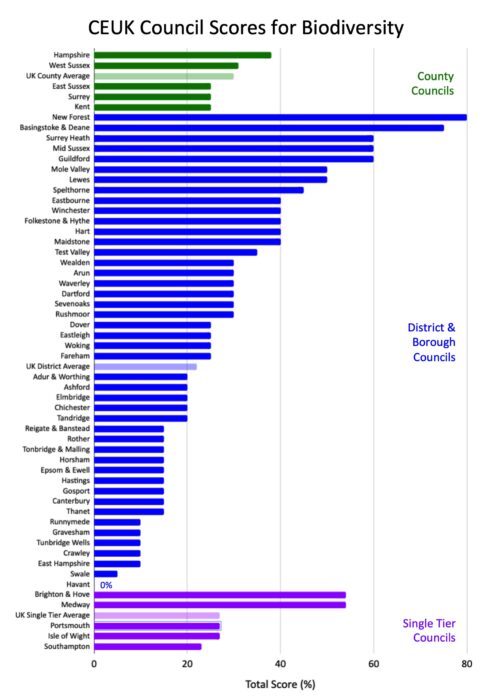 Biodiversity
- County councils in our region all scored poorly on biodiversity, and were close to the national average of 30%.
- In contrast, some district councils scored well above the district council average of 22%, for example New Forest at 80%, Basingstoke at 75%, and Mid Sussex, Surrey Heath and Guildford all at 60%.
- Requiring a biodiversity net gain commitment from new developments and employing a planning ecologist to scrutinise planning reports were two of the measures that contributed to this. This is the case for both New Forest and Basingstoke.
- Other measures that contribute are having Green Flag status for open spaces, having targets for tree cover, using peat-free compost, banning pesticides, and mowing less.
- Some councils scored especially low on this section despite some simple measures that can be taken – eg Havant with 0%, Swale at 5% and East Hants, Elmbridge, Gravesham, Runnymede and Tunbridge Wells all at 10%.
- Single tier councils did slightly better on average, with Brighton & Hove and Medway both scoring 54%.
Collaboration & Engagement
 Scores under this category were generally higher than for most others.
- County councils in our region mostly clustered around the national average of 59%, but East Sussex scored significantly higher (79%) and West Sussex lower (33%).
- Amongst district councils the majority of councils scored above the national average of 42%.
- Basingstoke scored especially highly at 90%, Folkestone and Chichester following at 70%. This shows that engagement and collaboration are achievable.
- Runnymede and Dartford were the lowest scorers in the southeast at 14%.
- One high scoring measure is banning high carbon advertising or sponsorship. Only 3 out of 186 UK district councils have done this – for example Basingstoke has an advertising policy that they will not accept ads that “could promote goods or services that contradict the climate change and air quality strategy, for example promotion of fossil fuels“.
- Other high scoring measures are providing funding for community climate action (nearly half of district councils have done this in some form) and publishing a climate action plan with SMART targets (around 2/3rds have done so). One clear plan with SMART targets comes from Basingstoke.
- Marks are also gained by publishing an easy to read annual report, providing ways of engaging with local residents, and working in partnership with schools, businesses and cultural institutions etc.
- Brighton & Hove and Medway scored highly amongst single tier authorities.
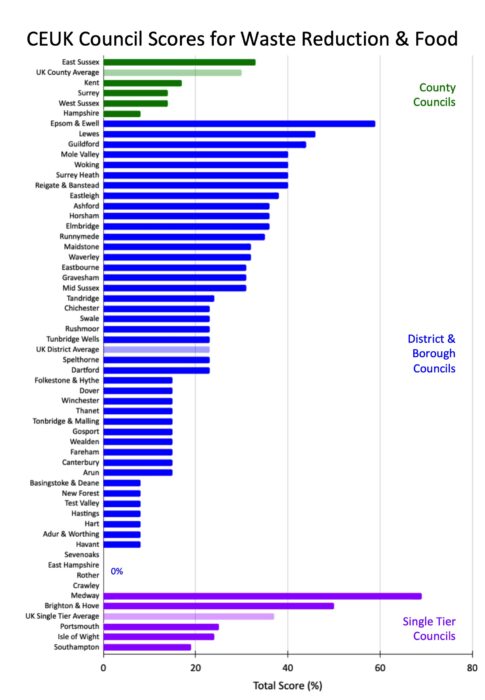 Waste Reduction & Food
- East Sussex (33%) was the only county council in our region to score above the national average under this category, with Hampshire scoring lowest (8%).
- Among districts, Epsom scored highest at 59%, with Lewes at 46% and Guildford at 44%.
- Epsom Council gained marks for recycling food waste, while Lewes Council scored well by being part of a sustainable food partnership.
- There were a lot of very low scoring districts, including Rother, East Hants, Crawley and Sevenoaks all with zero.
- Medway (69%) scored highest amongst single tier councils, with Brighton and Hove second (50%).
Digging down further
These highlights just scratch the surface of what is a rich and revealing dataset. To find out more visit the scorecard website at: https://councilclimatescorecards.uk/
You can search by council or by theme, and compare your council with neighbouring authorities and the UK average. And you can drill down to see details of the evidence used to come up with the individual scores. Studying the detail of the individual questions gives a valuable eyeopener on the potential measures that councils could take across all the themes together with the level of impact on emissions.
Further Background
How and why the scorecards were created
Local authorities are key players in addressing the net zero challenge. According to the Committee on Climate Change they have powers or influence over 30% of emissions in their local areas. That’s why it’s important we know how they are doing and why Climate Emergency UK took on this ambitious task.
It is telling that we have to rely on a tiny non-profit organisation with a small team and very limited resources to monitor climate progress, rather than a national reporting framework. But CEUK deserves great credit for pulling all this together.
To assemble the scorecard CEUK used an army of over 200 volunteer markers. Their job was to dig out evidence on what councils are actually doing, via a combination of web searches and Freedom of Information enquiries.
For each measure, weightings were given to reflect the impact it has on emissions, especially over the longer term. These vary depending on the type of council, as the mandate of county, district or combined authorities varies. Looking for questions with a ‘high’ weighting gives a good idea of the measures with the most impact potential on emissions. Some have a huge negative effect on council scores, for example approving oil drilling or airport expansion or new roads – factors that have led to Surrey and West Sussex County Councils both being marked down.
Details of the scoring system are all explained in the CEUK methodology section.
Caveats and quibbles
The scorecard is based on information available in February/March 2023, so by now some will be out of date. One of the central elements of the methodology was that evidence had to publicly available. So councils that were taking steps to address climate issues but not publicising them didn’t get credited for them.
Every council is likely to have questions and issues with the results, but CEUK did send out the draft scores to each council and gave them ‘right to reply’, so if there are inaccuracies that has been partly down to the councils to challenge. Around 74% of councils responded to the right to reply. And they have a month now the results are published to report any perceived mistakes.
There will no doubt be quibbles over the final scores – both from councils who feel their efforts are not being accurately reflected, and observers who are surprised by some scores looking surprisingly high. But despite this, all parties should be able to use the scorecard results and learn from them. It’s the best information we have and time is not on our side!
How to use the scorecards
The purpose of the scorecard exercise has been to spark change and CEUK have put considerable thought into how this might happen.
On their website there is a page on How to Use the Scorecards. There are suggestions for councillors and council officers, as well as members of the public and climate campaigners. The resources include:
- A media pack with advice about approaching the press
- Suggestions on how to approach your council etc.
- A campaigners guide on how to use the scorecard
- Information about training sessions
- A short summary of “15 Ways to improve your council’s climate action” that picks out some of the easier ways that councils can make a difference.
Sharing your comments and reactions
SECA would be very interested to get your reactions to the scores in your area. Do they reflect your experience of your council or were they a surprise? Please send your comments and observations to: southeastclimatealliance@gmail.com
The authors of this blog, Sally and Geoff Barnard, are members of the SECA Steering Group. Sally was one of the volunteers who helped compile the climate action scores (concentrating on other parts of the country, rather than the South East).